---
title: "From 17x Industry Benchmark to Optimized Efficiency: A Data-Driven Supplier Strategy"
subtitle: "Strategic Sourcing Analysis & Recommendations"
description: "A strategic sourcing case study showcasing how to transform supplier performance data into compelling executive presentations. Uses SCQA framework and consistent color strategy to guide from $47M overspend problem to $1.3M savings solution."
author: "Steven Ponce"
date: "2025-06-02"
categories: ["SWDchallenge", "2025"]
tags: [
"storytelling-with-data", "business-intelligence", "strategic-sourcing",
"procurement-analytics", "executive-presentation", "scqa-framework",
"data-storytelling", "cost-optimization", "supplier-analysis","quadrant-analysis",
"scenario-planning", "ggplot2", "business-strategy", "decision-support"
]
image: "thumbnails/swd_2025_06.png"
format:
html:
toc: true
toc-depth: 5
code-link: true
code-fold: true
code-tools: true
code-summary: "Show code"
editor_options:
chunk_output_type: inline
execute:
freeze: true
cache: true
error: false
message: false
warning: false
eval: true
---
### Original Business Case
> This month's Storytelling with Data exercise aims: Imagine that you work for a regional medical group that manages care facilities across your state. As part of a team responsible for reviewing medical products and evaluating suppliers, your role involves shaping company-wide strategies and policies across various medical centers. Recently, you and your team completed a strategic sourcing project assessing four suppliers (Suppliers A, B, C, and D) for a critical product category (XYZ Products).
>
> You have access to robust data, including historical usage and costs by medical center, satisfaction metrics from physicians and patients, and cost projections. The options on the table range from a single-supplier company-side contract to allowing each medical center to continue managing its own purchasing, each with clear trade-offs.
>
> You've put together a deck with your team to present the findings to the decision-makers. Your goal is to drive discussion and help the group reach a decision on future strategy. Below are the slides you've prepared.
{#fig-1}
Additional information can be found [HERE](https://community.storytellingwithdata.com/challenges/jun-2025-transform-a-graph)
### Makeover Business Case
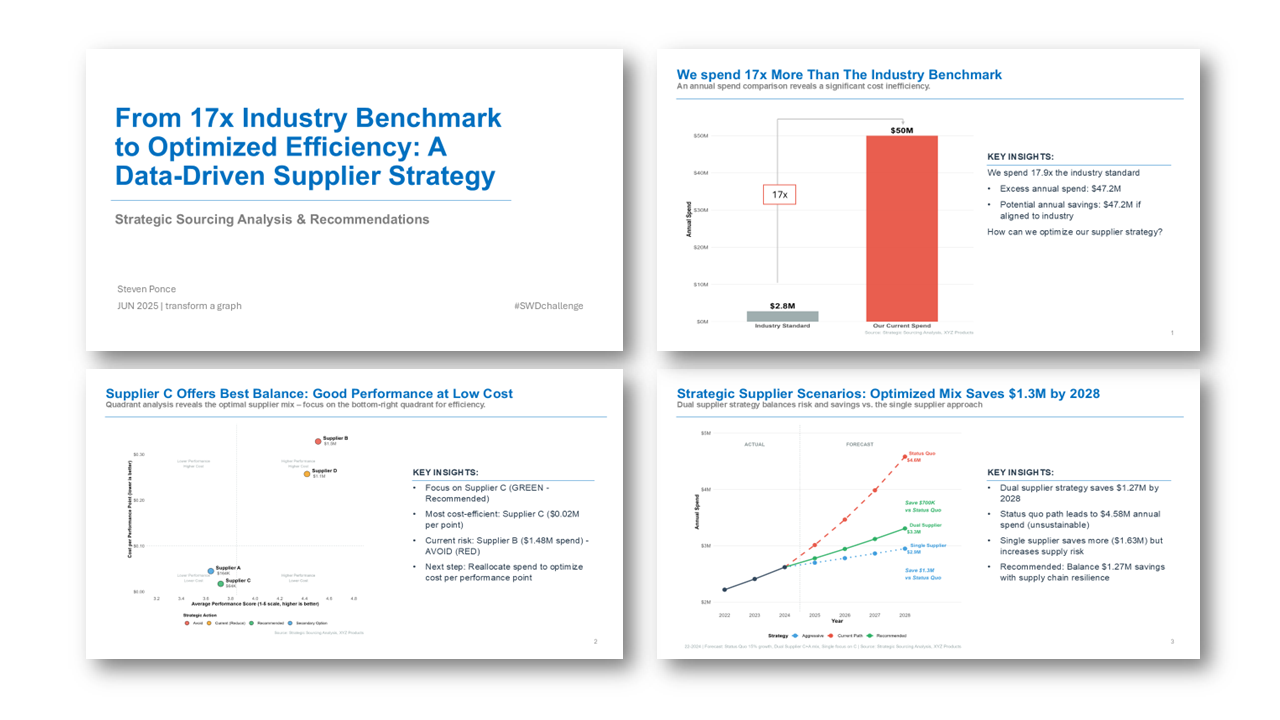{#fig-2}
### <mark> **Steps to Create these Graphic** </mark>
Note: The charts were generated using R and ggplot. The slide deck was build using MS PowerPoint.
#### 1. Load Packages & Setup
```{r}
#| label: load

if (!require("pacman")) install.packages("pacman")
pacman::p_load(
  tidyverse,    # Easily Install and Load the 'Tidyverse'
  ggtext,       # Improved Text Rendering Support for 'ggplot2'
  showtext,     # Using Fonts More Easily in R Graphs
  scales,       # Scale Functions for Visualization
  glue          # Interpreted String Literals
)

### |- figure size ----
camcorder::gg_record(
  dir    = here::here("temp_plots"),
  device = "png",
  width  = 8,
  height = 8,
  units  = "in",
  dpi    = 320)
```
#### 2. Read in the Data
```{r}
#| label: read

market_share_raw <- readxl::read_excel(
  here::here("data/SWDchallenge/2025/Supplier Sourcing Data.xlsx"),
  sheet = "market_share",
  skip = 2, trim_ws = TRUE
) |>
  janitor::clean_names()

cost_over_time_raw <- readxl::read_excel(
  here::here("data/SWDchallenge/2025/Supplier Sourcing Data.xlsx"),
  sheet = "cost_over_time",
  skip = 2, trim_ws = TRUE
) |>
  janitor::clean_names()

spend_by_facility_raw <- readxl::read_excel(
  here::here("data/SWDchallenge/2025/Supplier Sourcing Data.xlsx"),
  sheet = "by_facility",
  skip = 2, trim_ws = TRUE
) |>
  janitor::clean_names()

evaluations_results_raw <- readxl::read_excel(
  here::here("data/SWDchallenge/2025/Supplier Sourcing Data.xlsx"),
  sheet = "results",
  skip = 2, trim_ws = TRUE
) |>
  janitor::clean_names()
```
#### 3. Examine the Data
```{r}
#| label: examine
#| include: true
#| eval: true
#| results: 'hide'
#| warning: false

glimpse(market_share_raw)
glimpse(cost_over_time_raw)
glimpse(spend_by_facility_raw)
glimpse(evaluations_results_raw)
```
#### 4. Tidy Data
```{r}
#| label: tidy

# 1. Clean market share data ----
market_share_clean <- market_share_raw |>
  filter(supplier != "Total Spend") |>
  mutate(
    industry_share = as.numeric(industry),
    us_share = as.numeric(us)
  ) |>
  select(supplier, industry_share, us_share)

# Extract spend information separately
total_spend <- tibble(
  category = c("Industry", "Us"),
  spend = c("$2.8M", "~$50M"),
  spend_numeric = c(2.8, 50)
)

# 2. Clean cost over time data ----
years <- c("2022", "2023", "2024", "2025", "2026", "2027", "2028")

# Clean the supplier cost data (rows 2-6)
supplier_costs <- cost_over_time_raw |>
  slice(2:6) |>
  rename(supplier = x1) |>
  mutate(
    `2025` = case_when(
      supplier == "Supplier A" ~ 163910,
      supplier == "Supplier B" ~ 1481647,
      supplier == "Supplier C" ~ 64041,
      supplier == "Supplier D" ~ 1137230,
      supplier == "Total" ~ 2846828,
      TRUE ~ NA_real_
    )
  ) |>
  rename(
    `2022` = actual,
    `2023` = x3,
    `2024` = x4,
    `2026` = forecast,
    `2027` = x7,
    `2028` = x8
  ) |>
  select(-x5) |>
  pivot_longer(cols = -supplier, names_to = "year", values_to = "cost") |>
  mutate(
    year = as.numeric(year),
    cost_millions = cost / 1000000,
    period = case_when(
      year <= 2025 ~ "Actual",
      year >= 2026 ~ "Forecast",
      TRUE ~ NA_character_
    )
  )

# Extract scenario comparison data
scenarios <- cost_over_time_raw |>
  slice(8:10) |>
  select(x5, forecast, x7, x8) |>
  rename(
    scenario = x5,
    `2026` = forecast,
    `2027` = x7,
    `2028` = x8
  ) |>
  # Clean scenario names
  mutate(
    scenario = case_when(
      str_detect(scenario, "Status Quo") ~ "Status Quo",
      str_detect(scenario, "Single") ~ "Single Supplier",
      str_detect(scenario, "Dual") ~ "Dual Supplier",
      TRUE ~ scenario
    )
  ) |>
  pivot_longer(cols = -scenario, names_to = "year", values_to = "cost") |>
  mutate(
    year = as.numeric(year),
    cost_millions = cost / 1000000,
    period = "Forecast"
  ) |>
  filter(!is.na(cost))


# Clean the spend by facility data ----
spend_by_facility_clean <- spend_by_facility_raw |>
  filter(facility != "Grand Total") |>
  pivot_longer(
    cols = starts_with("supplier_"),
    names_to = "supplier",
    values_to = "spend"
  ) |>
  mutate(
    supplier = str_to_upper(str_remove(supplier, "supplier_")),
    spend_thousands = spend / 1000
  )

# Extract totals separately
facility_totals <- spend_by_facility_raw |>
  filter(facility != "Grand Total") |>
  select(facility, grand_total) |>
  mutate(total_thousands = grand_total / 1000)

supplier_totals <- spend_by_facility_raw |>
  filter(facility == "Grand Total") |>
  select(-facility, -grand_total) |>
  pivot_longer(everything(), names_to = "supplier", values_to = "total_spend") |>
  mutate(
    supplier = str_to_upper(str_remove(supplier, "supplier_")),
    total_millions = total_spend / 1000000
  )

# Clean the evaluations data ----
evaluations_clean <- evaluations_results_raw |>
  slice(2:6) |>
  mutate(
    metric = str_extract(test_metric, "^\\d+\\. .+"),
    metric = str_remove(metric, "^\\d+\\. ")
  ) |>
  rename(
    supplier_a = suppliers,
    supplier_b = x3,
    supplier_c = x4,
    supplier_d = x5
  ) |>
  select(metric, supplier_a:supplier_d) |>
  mutate(across(supplier_a:supplier_d, as.numeric)) |>
  pivot_longer(
    cols = starts_with("supplier_"),
    names_to = "supplier",
    values_to = "score"
  ) |>
  mutate(supplier = str_to_upper(str_remove(supplier, "supplier_")))

# Extract averages separately
supplier_averages <- tribble(
  ~supplier, ~avg_score,
  "A", 3.64,
  "B", 4.51,
  "C", 3.72,
  "D", 4.42
)
```
#### 5. Visualization Parameters
```{r}
#| label: params

# https://github.com/poncest/SWDchallenge/tree/main/2025/06_June
source("../../../../_CHALLENGES/SWDchallenge/2025/06_Jun/chart_1.R")
source("../../../../_CHALLENGES/SWDchallenge/2025/06_Jun/chart_2.R")
source("../../../../_CHALLENGES/SWDchallenge/2025/06_Jun/chart_3.R")
```
#### 6. Plot
```{r}
#| label: plot

create_benchmark_chart()
create_supplier_performance_chart()
create_strategic_scenario_chart()
```
#### 7. Session Info
::: {.callout-tip collapse="true"}
##### Expand for Session Info
```{r, echo = FALSE}
#| eval: true
#| warning: false
sessionInfo()
```
:::
#### 9. GitHub Repository
::: {.callout-tip collapse="true"}
##### Expand for GitHub Repo
The complete code for this analysis is available in [`swd_2025_06.qmd`](https://github.com/poncest/personal-website/tree/master/data_visualizations/SWD%20Challenge/2025/swd_2025_06.qmd). For the full repository, [click here](https://github.com/poncest/personal-website/).
:::
#### 10. References
::: {.callout-tip collapse="true"}
##### Expand for References
Original Slides:
- Document: [XYZ Products: Strategic Sourcing Plan Document](https://docs.google.com/presentation/d/1zqxsqSE9hfAGQorzDLyVsBU3gltY4Cz1/edit?slide=id.p1#slide=id.p1)
Data:
- Data: [Source Data](https://docs.google.com/spreadsheets/d/12YGQSg6C50wE-QI8L7F9Ghpeu-sNXH4U/edit?gid=2041126443#gid=2041126443)
:::

